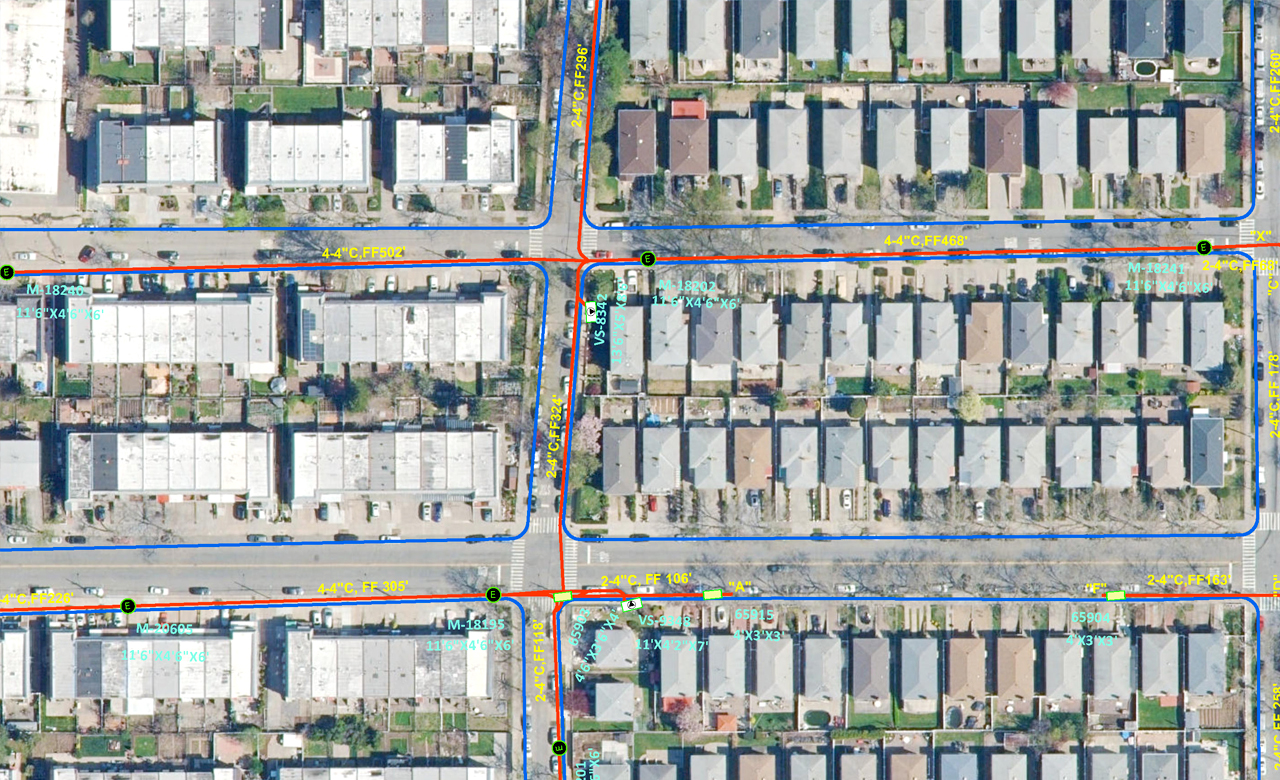
Utility maps are one of the key and most readily available sources of asset information in any country. These maps are widely used for positioning and identification of buried pipes and cables beneath the ground. The information content of these maps is shown, either in the form of graphics (e.g. pipelines, roads/railways, sewers, electric cables, telecoms cables, gas, and water mains), or text (e.g. assets annotation, place names, labels, and numbers).
Combining utility mapping with a topographical survey provides a comprehensive detailed map of the utility with underground or above-ground features. This kind of mapping is essential at the time when a ground digging activity is planned for maintenance or repair work, as the maps can then show the accurate and exact position of the buried utilities to be encountered. This is important, especially for the Indian geography, where sharing of asset information among various heterogeneous sectors is not that frequent. For example, the road construction department in India doesn’t have updated information about the underground assets beforehand, which leads to frequent damages to the underground pipes, during road construction. The utility maps are also used in conflation with satellite imagery to obtain a single integrated map.
What is the big challenge?
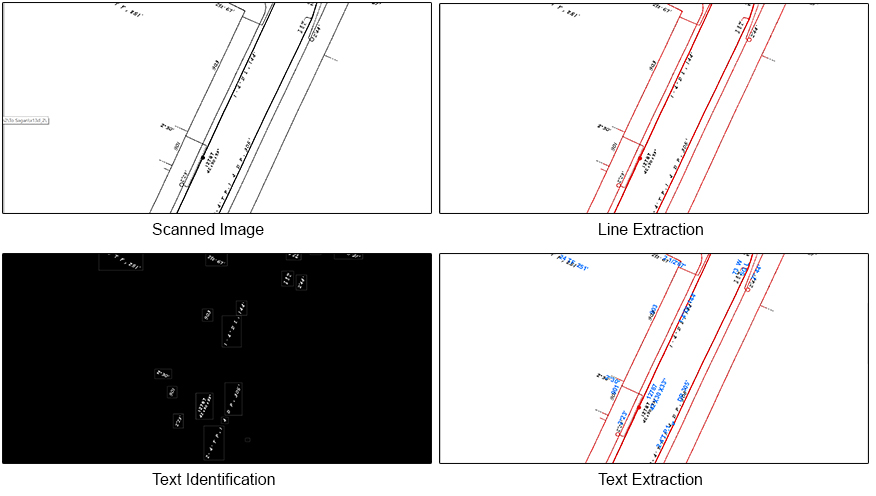
While most new maps are generated using computer programs, the majority of existing utility maps are only available as printed hard copies. The printing process combines the graphical and textual features into a single 2D layer and forms a complex mixture of heavily intersecting features, in which the individual information layers are no longer readily accessible. At the same time, all historical maps are hand drawings with handwritten text detailing the parameters of the features. These maps are scanned and stored as images in the utility databases. So classification or search for maps is a difficult task as spatial queries can’t be run on scanned images.
The development of automatic feature extraction algorithms for map understanding systems has, therefore, been of interest for a long time. Raster maps, or map images are heterogeneous and have varying image quality and complex text content, therefore, recognizing text labels is very challenging. In addition, the labels within a map do not follow a fixed orientation and can have various font types and sizes apart from hand-written texts.
How RMSI is helping to resolve this challenges?
Over the years, RMSI has built-up considerable expertise in data capturing for utility mapping on different types of utility businesses, e.g. telephone/power lines, water/gas mains, sewage systems, railway or signal mapping, oil pipelines etc. RMSI has developed systems that enable automatic extraction of various graphical features and recognition of the text content from scanned utility maps. The system takes a scanned utility map and produces each of the various graphical features extracted as separate layers, and the recognized annotation text as another layer. Our approach employs cartographic labeling principles to locate individual text labels over the graphical or line network layer.
This system consists of multiple stages:
- Text and graphics or line network separation
- Text recognition, and
- Automated quality checks
This blog talks about the automated feature extraction and text recognition methodology. The technology uses a line representation method based on directional morphological filtering to extract features with arbitrary orientation and curvature, such as roads and boundary lines, even when they are intersecting with the text. Once the linear features are removed, the system extracts texts from the images through various ML (Machine Learning) techniques for higher accuracy. Different models provide respective confidence scores based on which selective sampling is done by the system. This automated QC (Quality Control) further improves, efficiency by removing human-in-loop QC by 80%.
Less than 20% of the left-outs are then queued for human quality control checks. Post that, the system reorients the text to the original direction.
Once extracted, text is used to classify or search for maps that contain the name of a particular utility asset, street, area, or lane markings in a database of map images, or to add such information to satellite imagery.
What’s Next?
Generating highly accurate, publicly available and free to use utility maps, can be a game-changer in the coming years. Countries like India can really benefit from a readily available spatial utility layer in a digital format, which can be used by the government and utility industry for new planning and maintenance of existing utility services such as telecom, water mains or gas pipelines.