<< backIn Focus
Building Climate Resilient Livelihood in Gambia Using Geospatial Technology
Client: Ministry of Environment, Climate Change, and Natural Resources, Republic of the Gambia with support from African Development Bank (AfDB)
Start Date: August 2019 | End Date: April 2020
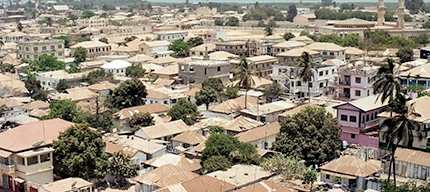
The vulnerability of climate change is complex and diverse in West Africa. One such country experiencing climate extremes (such as drought & flood) is Gambia, a small country located along the Gambian river. The Atlantic Ocean surrounds Gambia to the west and Senegal along all other borders. Gambia is one of the densely populated countries in Africa. The city is built on a small peninsula between mangrove-lined estuaries and the Gambia River, which rises out of the Fouta Djallon Highlands of Guinea. With its natural port, Banjul is an important trading post between West Africa and the world.
CLIMATIC COMPLEXITIES IN THE GAMBIA
Gambia’s climate is Sahelian and characterized by high variability in the amount and distribution of annual precipitation. As a result, weather and climate-related hazards (drought, flood, heat wave, strong wind, and dust storm) constitute about 90 percent of natural disasters in the Gambia.
The agricultural sector in Gambia is primarily rain-fed, with less than 2,000 ha of the 81,000 ha of arable land currently under irrigation. It contributes around 20 percent to the country’s GDP and employs 46 percent of the labour force. It’s the livelihood support for 80 percent of the rural population. The agri sector is highly vulnerable to rainfall variability, with yields of some major crops fluctuating significantly from year to year. Since the 1960s, crop yield has decreased as much as 30 percent due to reduced rainfall, and decline in rainy days and soil fertility from widespread land degradation. Rainfall is mainly seasonal, the majority between June to October.
Climate change in the Gambia has been impacting people’s health and agro-ecosystem heavily. It has transformed into a significant problem due to high vulnerability to climate change, exacerbated by a low capacity to address and adapt to the change.
A major barrier is the nation’s inability to effectively predict significant extreme events due to climate change, assess potential impacts, and provide short/long-term warnings. In light of this, RMSI analysed the historical and future projected climate data to evaluate the extent of future climatic changes along with improvements needed in the health and agri sector to build climatic resilience.
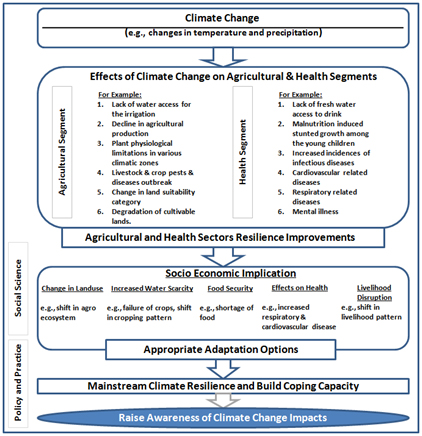
Figure 1 depicts pathways to build climate resilience in the agricultural and health sectors.
Figure 1: Pathways, suggested by RMSI, to build climate resilience in agri & health sectors
HISTORICAL CLIMATIC VARIABILITY
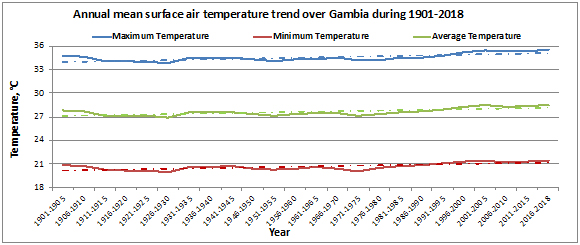
- In recent years, the Gambia has experienced a surge of about 2°C in temperature. According to RMSI analysis, the average annual of maximum, minimum & mean temperatures are shown in Figure 2.
Figure 2: Historical trends in annual mean temperatures over the Gambia
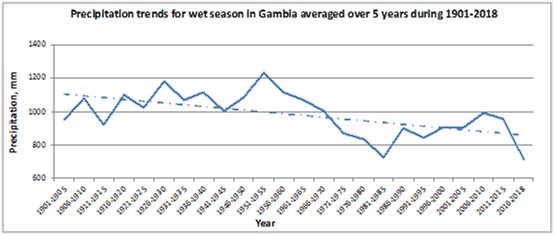
- An analysis of historical rainfall reveals that while the frequency of heavy rainfall events has increased, the wet days have decreased. Figure 3 highlights a decreasing trend in seasonal rainfall during the wet season from 1901-2018. On an annual basis, a similar trend of decline in rainfall has been witnessed.
Figure 3: Historical trends in precipitation during the wet season (June to October) over the Gambia
The rising temperature and inter-annual and decadal variability in precipitation will continue to result in increased frequency and intensity of natural disasters, such as floods, droughts, and wild forest fires. Hence, it is expected that the country will become more exposed to climate shocks in future.
FUTURE CLIMATE PROJECTIONS
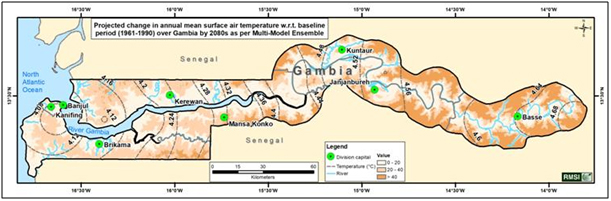
- The temperature in the Gambia is expected to increase by 1.3°C by the 2020s, 2.7°C by the 2050s, and 4.4°C by the 2080s. Figure 4 depicts how different parts of the country are expected to experience a rise in temperature by the 2080s.
Global warming doesn’t obey any geographical boundary. Therefore, each country needs to follow stringent mitigation actions and make concerted efforts to reduce greenhouse gas (GHG) emissions.
Figure 4: Spatial distribution of projected change in annual surface air temperature by 2080s
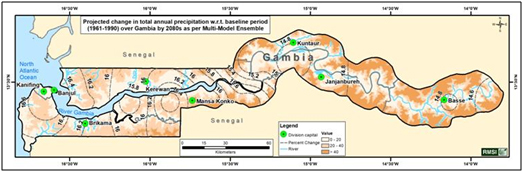
- The country is likely to experience the same quantity of rainfall in the coming years. But, due to the highly erratic rainfall distribution pattern during the rainy season (June to October), Gambia is likely to encounter more extreme events (drought & flood) in the future. For instance, there might be heavy rainfall at once, and next would be a dry spell for a certain period. Figure 5 depicts the spatial distribution of projected changes in annual rainfall across the Gambia during 2080s.
Figure 5: Spatial distribution of projected change in annual rainfall (percent) with by 2080s
Although climate change is impacting everything in the Gambia, some sectors such as agriculture and health are more vulnerable than others. Therefore, as a long-term measure toward mitigation and planning, it is essential that the country systematically identify the indicators and their contribution to the vulnerability of agricultural and health sectors to climate change. Therefore, a logical approach is to create the Climate Vulnerability Index (CVI) to understand this aspect.
The CVI helps identify hotspots and rank the different LGAs (Local Government Areas) of the country. The ranking will help prioritize investment for mitigation and coping with the impacts of climate-related stresses or shocks.
CLIMATE CHANGE IMPACT ON AGRICULTURE
Geospatial technology was applied to collate and standardize climate risk indicators to generate vulnerability ratings for the agricultural sector to assess climate change impact in the Gambia. RMSI identified appropriate indicators influencing the agricultural sector to define CVI. As vulnerability is a function of exposure, sensitivity, and adaptive capacity, these three elements are interlinked to derive CVI.
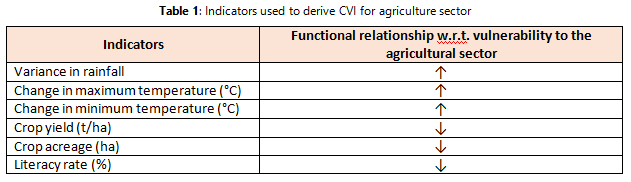
The socio-economic factors, crop acreage & productivity and weather variables were the indicators to derive CVI (Table 1).
Table 1: Indicators used to derive CVI for agriculture sector
Here, the CVI indicators had a direct functional relationship with the vulnerability. For example, an increase in maximum temperature or change in annual rainfall, or diurnal variation in temperature increases the agricultural sector's vulnerability. Hence, the climatic variables have increased the vulnerability of the agricultural sector.
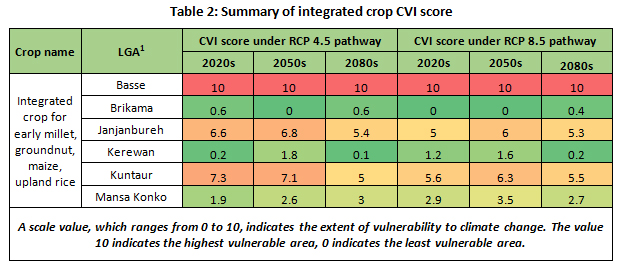
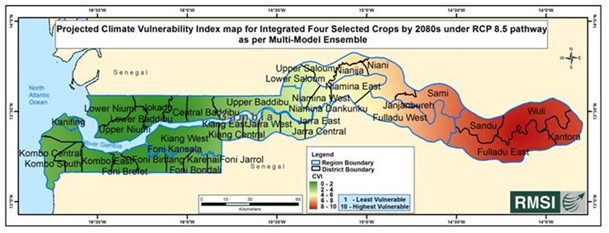
RMSI analysed CVI for early millet, groundnut, maize, and upland rice separately and later, combined them to make integrated crop CVI score (Table 2 & Figure 6).
Figure 6: Projected integrated crop CVI maps by 2080s
While comparing the four crops’ integrated CVI among the LGAs, Basse is likely to be the most vulnerable across all the future climate change scenarios as it is expected to face more severe climatic conditions than other LGAs.
CLIMATE CHANGE IMPACT ON HEALTH
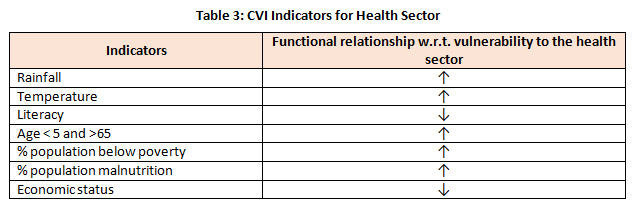
Recent observed changes in the climatic pattern have affected human health in terms of extreme events (heat waves, heat stress, storm, cyclone & flood) and increased threat due to malaria and water & vector-borne disease. In addition, climate change will further amplify health-related risks in the vulnerable LGAs, influence infectious disease emergence, affect food availability and nutrition, increase the risk of climate‐related disasters, and impair mental health. Hence, the health authorities needed a source to identify severe health threats, take protective measures to reduce current impacts and future risks, and empower individuals to build climate-resilient health systems. Table 3 highlights the CVI indicators for health sector.
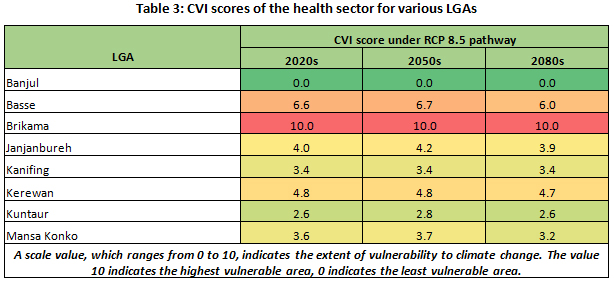
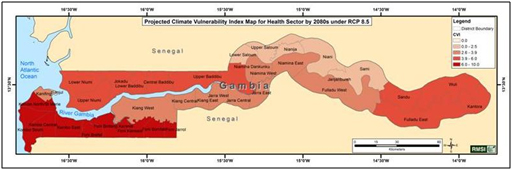
RMSI analyzed CVI for each disease, such as cholera and typhoid, separately and subsequently combined it to make integrated health CVI score (Figure 7).
Figure 7: Projected integrated CVI for health sector by 2080s
A high CVI health score for Brikama is likely to be observed due to demographic indicators and relatively high variability in the climatic pattern by the 2080s.
IMPACT AND WAY FORWARD
This RMSI study will help Gambia in the following ways to build climate resilience in agricultural and health sectors:
- Rank and prioritize various LGAs according to their vulnerability and identify critical areas
- Generate a list of spatially explicit measurable and monitorable variables and indicators identified in this study to assess vulnerabilities
- Develop climate-smart livelihood options for different socio-economic groups and biophysical settings across the Gambia
- Spatially identify climate change impact and coping mechanisms to be adopted in different locations
Many of the challenges for implementing a climate-resilient livelihood are institutional. Hence, to reduce the vulnerabilities and costs of actions, current and future climate variability must be factored into the multiple ministries' decision-making and mainstreamed into national planning and finance agendas. In all of this, technology has a significant role and an immediate need for knowledge sharing and collective learning of better systems to manage livelihoods in the face of changing climate scenarios.
Recent Wins
Study on Issue of Flood and Siltation in River Ganga and its Tributaries due to Farakka Barrage, Bihar
Flood Plain Zoning in Meghalaya
Current Development Projects
Study on Risk Management & Resilient Infrastructure Development of Inland Water Transport (IWT), Assam
Hazard Mitigation & Resilience Plan, U.S. Virgin Islands
Events
RMSI acknowledged as 'Partner of the Year - ISV Solution' by Esri India
RMSI Webinar on Flood Forecasting & Early Warning Systems, June 2021
International Conference on Disaster Risk Management, July 2021
Expert in Focus
Dr. Pratap Singh
Water Resources Expert & VP - Sustainability, RMSI